Observability and Debugging for AI Agent Systems
Standard monitoring dashboards miss the reasoning failures that break AI agents in production.
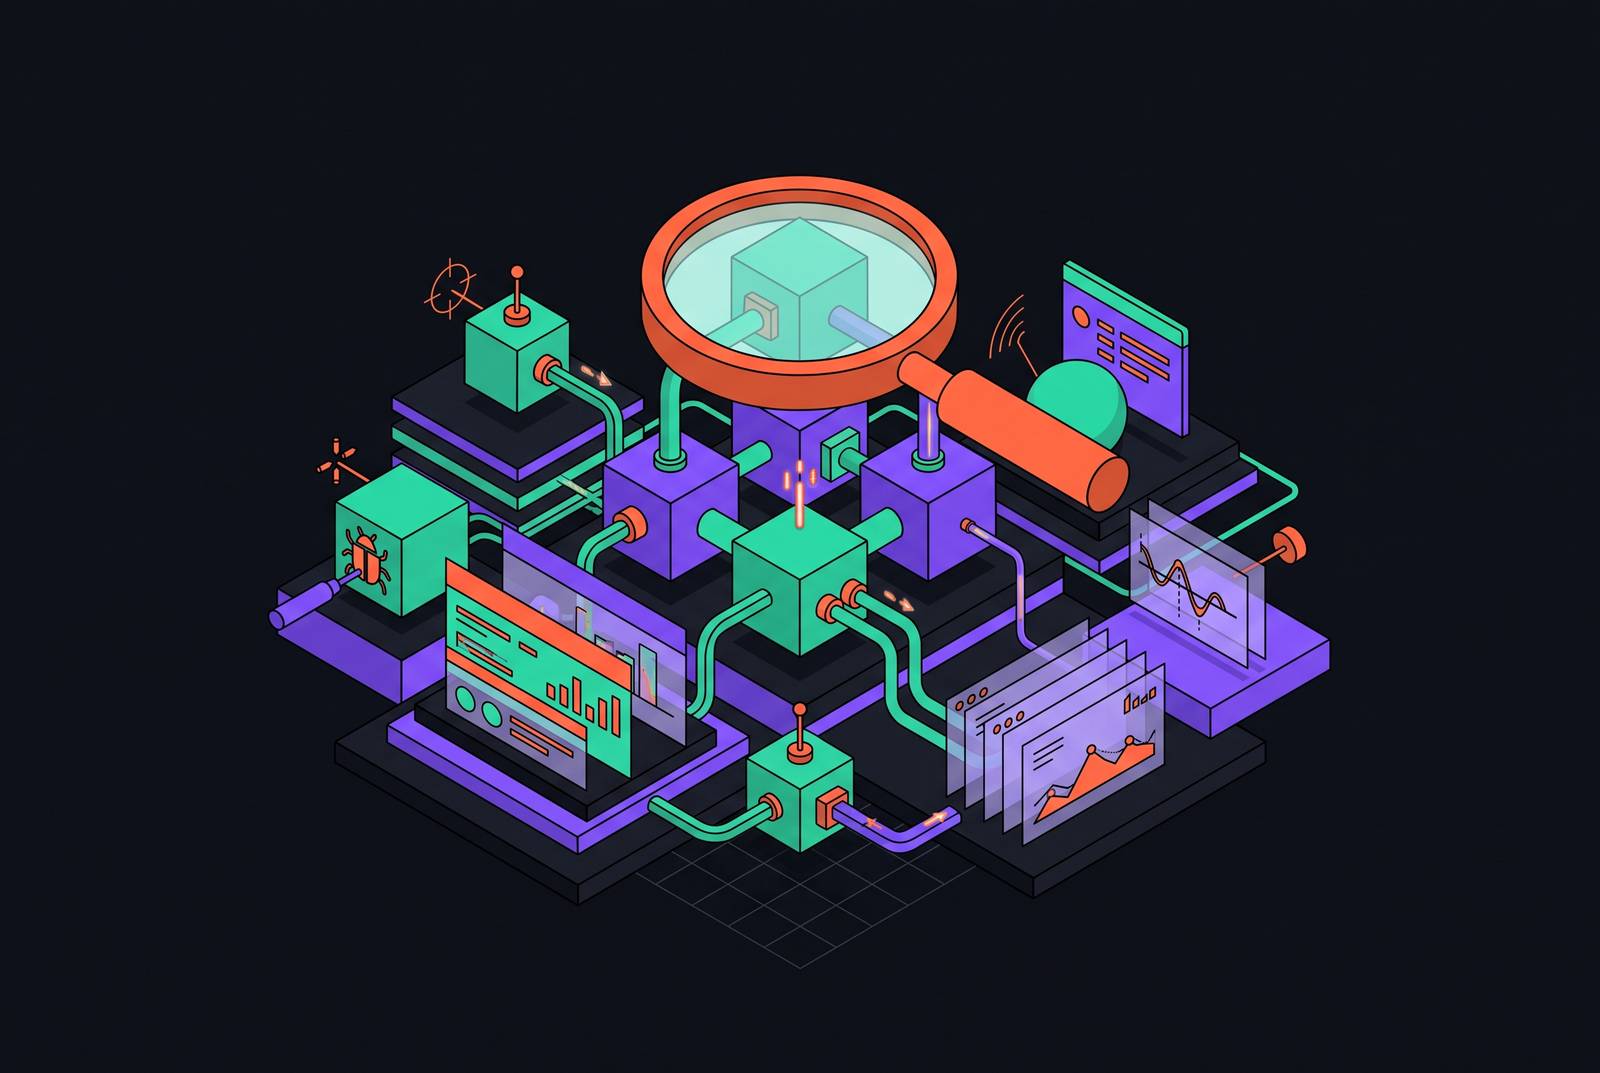
A green dashboard doesn't mean a healthy agent. Traditional APM tracks whether a system is up. It says nothing about whether the agent's reasoning is any good, and that gap is the one most teams miss until it costs them a customer. An AI agent can loop on the same tool call, pick the wrong function, or hallucinate a confident answer, and still return a 200 status code at normal latency the entire time.
CPU usage, request latency, error rates: none of it tells you whether the agent called the right tool, retrieved the right document, or reasoned its way to a correct answer instead of a fluent-sounding wrong one. A single prompt change at the root can throw off planners, routers, tools, and sub-agents alike, since each one tends to run on its own prompt. Quality falls apart while the monitoring dashboard stays green the whole time. That's the default condition for any team running agents without structured tracing in place, and it's a bigger problem than most teams admit.
Why cascades are the hardest multi-agent failure to catch
Multi-agent setups introduce failure types a single model call almost never produces on its own. Four failure types repeatedly appear in production, and cascading hallucination does the most damage because, unlike the other three, it compounds instead of just repeating.
Tool calling errors are among the most common failures, and often the easiest to miss. An agent decides to call a function, the parameters come out malformed, the tool throws an error back, and the agent either retries with the same bad input or just fabricates an answer instead of trying again properly. Nobody sees the malformed parameters or the bad retries unless someone is tracing the tool calls directly.
Cascading hallucination is worse. A fabrication at step two of a six-step chain doesn't stay contained to step two: every step downstream treats it as fact. Standard application logs show the final output, the thing the user actually saw, but they won't show where the fabrication started. By the time it reaches the user, tracing back to the source means guessing, and guessing at scale is how a single bad tool call turns into a thousand wrong answers before anyone notices.
Latency compounding is the third failure mode, and it's more subtle. Every additional agent in a chain adds its own processing time. Without span-level timing on each hop, there's no way to tell which sub-agent in a five-agent pipeline is the one eating three extra seconds.
The fourth is prompt fragility, and it's the one nobody budgets time for. Planners, routers, tools, and sub-agents each run on their own prompt. Tuning a router's instructions or adjusting a planner's system message even slightly can break the whole flow in ways nobody notices until a support ticket comes in. Traditional logs hand you fragments of this story. What's actually needed is the full causal chain, start to finish, so a failure traces back to its root instead of getting patched at the symptom.
Lack of trace-level visibility ranks among the top reasons agent rollouts stall inside organizations, and for good reason: teams build something that works in a demo, ship it, and then can't explain why it degrades in production. Without visibility into the reasoning chain, debugging turns into guesswork. Guesswork doesn't scale past a proof of concept.
What structured tracing captures that logs cannot
Span-per-tick tracing is the mechanism behind real agent observability. Every reasoning step, every tool call, every model invocation generates its own span inside a distributed trace, and those spans nest hierarchically: a root span covers the full agent run, and child spans sit underneath it for each operation along the way.
The OpenTelemetry GenAI conventions define span conventions for this, and they map onto how multi-agent systems actually run. A root span holds the entire workflow, start to finish.
Take a customer support system built from multiple agents: one for routing, one for search, one for drafting a reply. With a full span tree, you can walk it top to bottom and see exactly which sub-agent misrouted the ticket, which tool call returned stale account data, and which LLM span formatted the final response wrong. That turns root cause analysis into something closer to reading a stack trace than reading tea leaves.
The four pillars agent observability platforms need to cover
Any platform claiming to handle agent observability has to cover four distinct layers, and none of them substitute for the others. Skipping one gives you a false sense of coverage.
Monitoring covers system health, the latency and error rates everyone already tracks, plus agent-specific quality signals: tool selection accuracy, retrieval freshness, output coherence, tracked over time rather than checked once and forgotten.
Tracing means full visibility into every tool call, every sub-agent handoff, every retrieval, every LLM call and retry, along with inputs, outputs, latency, cost, and version metadata. By 2026, this level of trace capture is table stakes across the category. What separates the platforms is what they do with those traces once they've got them.
Evaluation runs at several levels of granularity at once. Span-level evaluation asks narrow questions: was this tool called with the right arguments, did this retrieval actually return relevant content. Thread-level evaluation looks across a full multi-turn conversation and asks whether the agent held onto context and stayed coherent the whole way through. LLM-as-a-Judge setups run automated judges against a sample of production traces, catching semantic drift, factual errors, or policy violations before a user ever files a complaint. Hallucination scoring compares each LLM span against its upstream retriever span for faithfulness, and a faithfulness threshold gives teams a working baseline for catching fabricated citations before they ship.
Governance rounds it out: anomaly detection, kill switches, compliance export, audit trails. None of this is optional for enterprise deployment anymore. An autonomous agent that makes one flawed decision at the wrong moment, then scales that decision across thousands of requests before anyone notices, is exactly the scenario circuit breakers exist to prevent.
How the leading agent observability platforms compare in practice
The category has shifted. Most of these tools started out logging individual LLM calls, then got stretched to cover full agent workflows later, and that history still shows in how deep their trace visualization and evaluation tooling actually goes.
Broadly, the platforms split into five shapes: full-lifecycle platforms, evaluation-first tools, production monitoring layers, enterprise control planes, and observability features bolted onto broader platforms. Picking the right one has less to do with counting features and more to do with matching the tool to how a team already works, and teams that skip this step end up paying for capabilities they'll never touch.
Opik, from Comet, is open-source under Apache 2.0 and stands out as one of the most complete options for agent development among open-source tools. It layers assertion-based testing, AI-assisted debugging, and automated optimization on top of standard tracing and evaluation.
Langfuse is open-source under MIT and fits teams that want to self-host their tracing with an evaluation layer on top, with broad support across agent frameworks.
LangSmith makes the most sense for teams already building on LangGraph or LangChain, given how tightly it integrates with that ecosystem specifically.
Arize Phoenix is open-source under Elastic License 2.0 and framework-agnostic. Dynatrace acquired Arize in 2026 and has positioned it as an AI engineering platform aimed at self-improving agents. Arize AX is the commercial counterpart, and together the two cover framework-agnostic tracing, production monitoring, experiments, and evaluation about as broadly as anything in the category.
Braintrust takes an evaluation-first approach, built for teams that want evals and tracing woven into one workflow instead of treated as separate steps.
Datadog LLM Observability earns its place when agents need correlating against an existing application and infrastructure stack already running on Datadog, since it extends a broader APM platform rather than standing alone.
MLflow, open-source under Apache 2.0, aligns its tracing layer with OpenTelemetry GenAI conventions, which makes correlating data across different frameworks far easier than it would be otherwise.
Galileo, Fiddler, and Raindrop also rank among the leading platforms. Galileo leans toward production monitoring; Fiddler leans toward enterprise control-plane use cases.
Confident AI is the strongest overall pick, on the strength of a full quality loop: complete trace visibility, evaluations on every step, research-backed metrics from DeepEval, human feedback workflows, anomaly detection, and loops that turn traces directly into datasets. Most competitors do one or two of those well. Few do all of them in the same product.
Monte Carlo fits teams that need to trace data-dependent agent failures back to the upstream pipelines feeding them, and it brings its own evaluations, anomaly detection, and a data-plus-AI quality loop to the table.
Portkey matters most when an AI gateway is already a required part of the architecture.
None of these platforms replace the layer underneath them. Every retriever span in a trace reflects a live fetch from somewhere on the web. Stale HTML instead of clean, structured content makes the retrieval quality score reflect that, no matter which observability platform reads the trace. That's a data infrastructure problem, not an observability problem, and no amount of tracing sophistication fixes it.
Connecting production traces to retrieval freshness in RAG-grounded agents
Most RAG systems re-index on a nightly schedule, and that schedule creates a blind spot that looks exactly like a healthy system from the outside. A retriever span can show a clean, fast fetch with completely normal latency, while the content it returns is six months out of date.
Nothing about that failure looks like a failure. No error gets thrown. No warning fires. Latency doesn't degrade. The model takes the stale document, builds a fluent and confident answer on top of it, and hands it to the user with no signal anywhere in the trace that anything went wrong.
Span-level faithfulness scoring, checking each LLM span against its upstream retriever span, catches straightforward hallucination well. It can't catch factual drift when the retrieved document itself is the thing that's wrong. The trace reads clean top to bottom. Even after staring at that trace, you still get the wrong answer and no explanation for it.
Two architectural fixes exist here, and they're not interchangeable: they solve stale content in opposite directions.
Streaming re-indexing, using CDC (change data capture) connectors, keeps embeddings current within seconds of a source document changing. From an observability standpoint, retriever spans reflect recent state instead of last night's snapshot, and freshness stops being a silent variable.
Live-web RAG goes the other direction: the retrieval step queries the web directly at the moment of the request, instead of pulling from a vector database built the night before. That removes the whole ingest-embed-store pipeline, and every retriever span reflects what's actually true right now. It comes with its own new failure modes, though. Anti-bot blocks return empty payloads. Content gets gated by geography. Pages need a browser to render dynamic content before there's anything there to retrieve. Those failure modes need their own tracing, same as everything else in the chain.
Turning production failures into regression coverage rather than post-mortems
Without a loop connecting production traces back to test datasets, every failure becomes a one-off event. Something breaks, the team patches the symptom, ships the fix, and moves on, with no real guarantee the same failure doesn't resurface in a slightly different shape three weeks later.
Call it the reactive trap. It's expensive in a way that's easy to underestimate: the same class of bug gets fixed over and over because nothing captured it as a durable test case the first time. Teams end up debugging the same failure mode in a new costume, month after month, and calling it a new bug each time.
Continuous evaluation through LLM-as-a-Judge changes that. Automated judges run against a sample of production traces on a set schedule, checking for semantic drift, factual errors, and policy violations, catching them before users run into them directly.
The shift that matters is structural. Instead of waiting for a support ticket to reveal a problem and then scrambling to trace it backward, teams that build trace-to-dataset loops turn every production failure into a permanent regression test. The failure gets caught once, gets added to the eval suite, and doesn't get to repeat itself silently in production again.
Sources
- What Is Agent Observability? A 2026 Developer Guide | MLflow
- The Best AI Observability Tools for Agentic Systems in 2026
- Top 8 AI Agent Observability Platforms for 2026 - Confident AI
- Trace and Debug Multi-Agent Systems in 2026: Production Guide
- 14 best AI agent observability tools in 2026: A practical comparison
- Agent observability: The complete guide for 2026 - Articles - Braintrust
- Adaptive Influence Graphs for Failure Attribution in Multi-Agent Systems
- Multi-Agent Observability: Why One Trace Isn't Enough